Teacher Luo Yuemei guides undergraduate students to publish papers in the journals of the Second District of the Chinese Academy of Sciences
- IMIC Lab
- News , Comprehensive news
- May 27, 2025
Research background
Deep learning has shown great potential in medical image analysis, especially in the task of retinopathy classification based on optical coherence tomography (OCT). However, deep learning models still face many challenges in the diagnosis of retinal diseases based on OCT images. For example, current classic deep learning methods treat images as a grid or sequence structure, which limits the capture of irregular and complex objects, thereby reducing flexibility. In addition, OCT equipment in different medical institutions has significant differences in image distribution (domain shift) due to differences in light source wavelength, detector sensitivity and imaging mode, which seriously restricts the generalization performance of deep learning models.
Teacher Luo Yuemei’s research group at Jiangsu University Key Laboratory of Intelligent Medical Image Computing is committed to the research of OCT imaging and deep learning automatic recognition algorithms. In response to the above problems, Teacher Luo Yuemei guided undergraduate students to propose a new retinal disease classification method based on Pyramid Visual Graph Convolution Network (PVGCN) and a cross-domain retinal disease classification method based on Domain Adversarial Graph Convolution Network (DAGCN). The research result “Classifying Retinal Diseases via a Novel Pyramid Vision Graph Convolutional Network for Optical Coherence Tomography Images” was recently accepted by the journal “Biomedical Optics Express” of the Second District of the Chinese Academy of Sciences. The PVGCN proposed in the paper achieves high-precision classification while reducing computational costs by constructing a novel graph structure representation and pyramid structure. For cross-domain classification problems, the DAGCN model significantly improves the robustness of cross-domain retinopathy classification by integrating data structure-aware alignment and class center alignment modules. Relevant research results “Cross-Domain Retinopathy Classification Based on Optical Coherence Tomography Sensors via Domain Adversarial Graph Convolutional Network)” have also been published in the “IEEE Sensors Journal”, the journal of the Second District of the Chinese Academy of Sciences. The first authors of these two papers are Qian Jin and Tao Lei, both of whom are from Class 2 of 2021, Artificial Intelligence Major, School of Artificial Intelligence, Nanjing University of Information Science & Technology.
Paper 1: “OCT Retinal Disease Classification Based on New Pyramid Visual Map Convolutional Network”
- Introduction
Regarding the OCT retinopathy classification problem, the efficiency of existing deep learning methods in processing OCT images still faces several key technical challenges: First, using different structures to process OCT images has different effects, resulting in insufficient flexibility; secondly, the conventional neighbor information graph convolutional neural network (GCN) causes over-smoothing problems in the gradual propagation and convergence of feature information during each round of iterative update process, resulting in poor performance. In addition, isotropic structures do not distinguish between information at different scales when processing OCT images. This approach ignores the natural physiological differences between different tissue structures and cannot fully capture the information in the image in detail and flexibility.
In order to solve the above shortcomings, we propose a pyramid architecture PVGCN, which continuously aggregates and updates the information of each node and neighbor nodes in the graph through improved graph convolution blocks, so that the position information between retinal tissue structures is more closely connected. FFN is added to perform nonlinear transformation of node features and use residual connections, which can alleviate layer collapse and over-smoothing phenomena while achieving high-precision retinopathy classification.
In order to fully understand the information of complex retinal disease OCT images, a progressively reduced pyramid architecture is adopted. This method decomposes the OCT retinal image into multi-scale sub-images for processing, and can extract information of different scales for fusion, improving the global field of view. At the same time, the gradual reduction strategy can reduce the amount of calculation. This processing method makes PVGCN more flexible to extract information step by step, understand and utilize information more effectively, and better identify different tissue structures in the retina.
- Method
Figure 1 is the algorithm flow chart of this paper, which can be divided into the following steps:
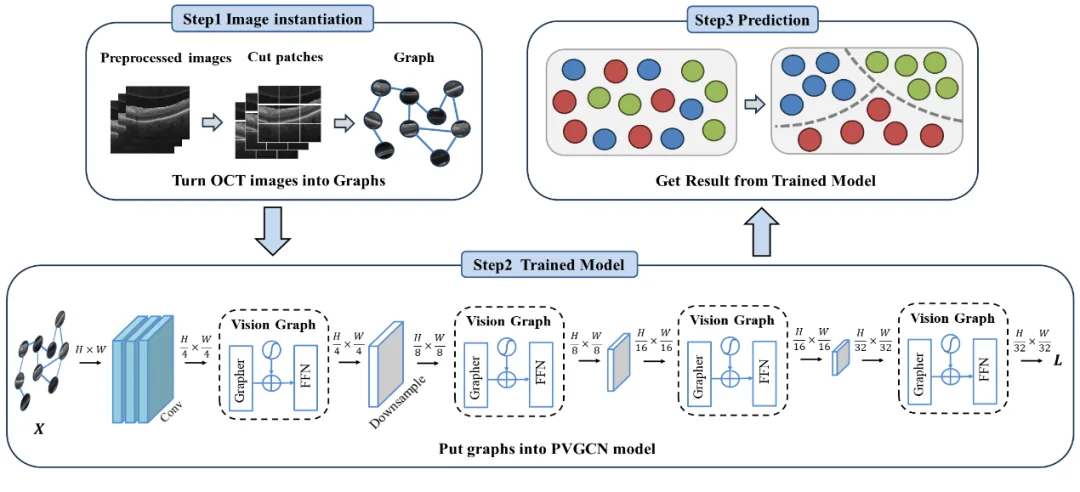
Figure 1: Algorithm flow chart
As shown in Figure 1, we demonstrate the process of completing case classification for OCT case images. Taking AMD, DME and NORMAL as examples, we first cut the images in three different types of OCT data sets into nodes in the Image instantiation part, and then establish connections between each node to form a graph structure. For the construction of the graph structure, we divide the image of size H×W×3 into N blocks and convert them into feature vectors. Finally, we connect each node to obtain the Graph, as shown in step one.
In step two, the image is output as graph data X through the above steps. We input X into the trained model part. As the number of layers deepens, the size of the extraction space is continuously reduced, and finally a progressively reduced pyramid structure is formed. During this training process, the model is trained according to the loss value L.
In step three, we input the test set data into the trained model for prediction and complete the retinopathy classification task.
- Experimental results
In this study, two retinopathy data sets were used, namely the BOE data set and the CELL data set.
The experimental results are shown in Table 1-2. It can be seen from the experimental results that PVGCN outperforms all other compared baseline methods on both BOE and CELL datasets. This demonstrates the effectiveness of PVGCN in detecting retinopathy using OCT images. In addition, the accuracy of our proposed PVGCN method on the two data sets is 0.9954 and 0.9787, the precision is 0.9918 and 0.9650, the recall rate is 0.9877 and 0.9555, and the F1 is 0.9896 and 0.9602, respectively. It can be concluded that PVGCN significantly outperforms all baseline methods and performs well in these two data sets.
Table 3 uses the data amounts of 0.8, 0.5, 0.2, 0.1, and 0.05 of the original data set to train these methods respectively, and finally obtain different proportions of data. When the data amount gradually decreases, the differences between several methods gradually become apparent. When the data amount is 0.05 (about 4224 OCT images), the difference in accuracy between the algorithms is the largest. It can be seen from the final results that PVGCN is nearly three percentage points higher than VGG-16. Therefore, we can conclude that PVGCN outperforms several other methods on the BOE and CELL datasets.
Table 1: Experimental results on BOE data set
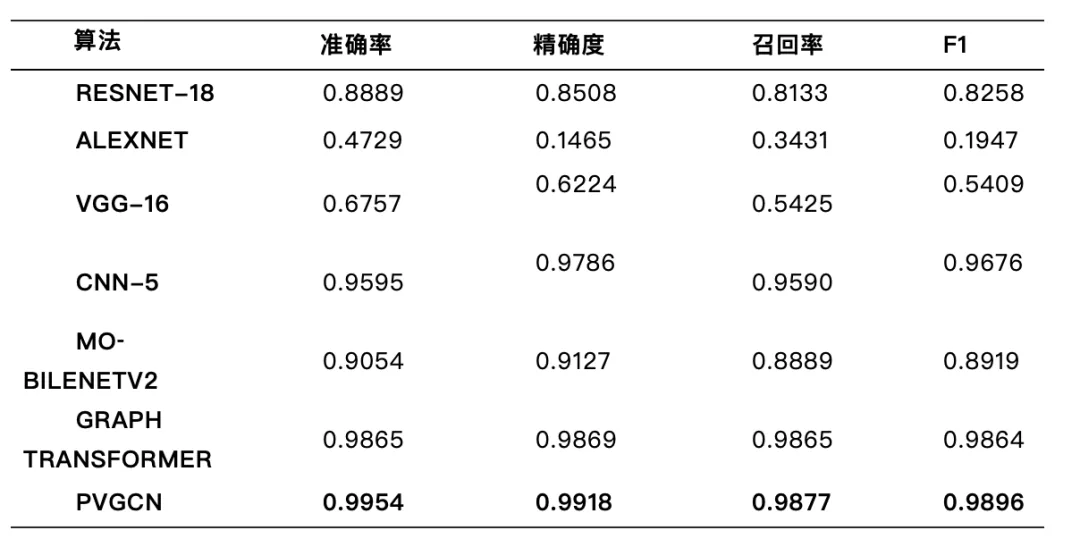
Table 2: Experimental results on CELL data set
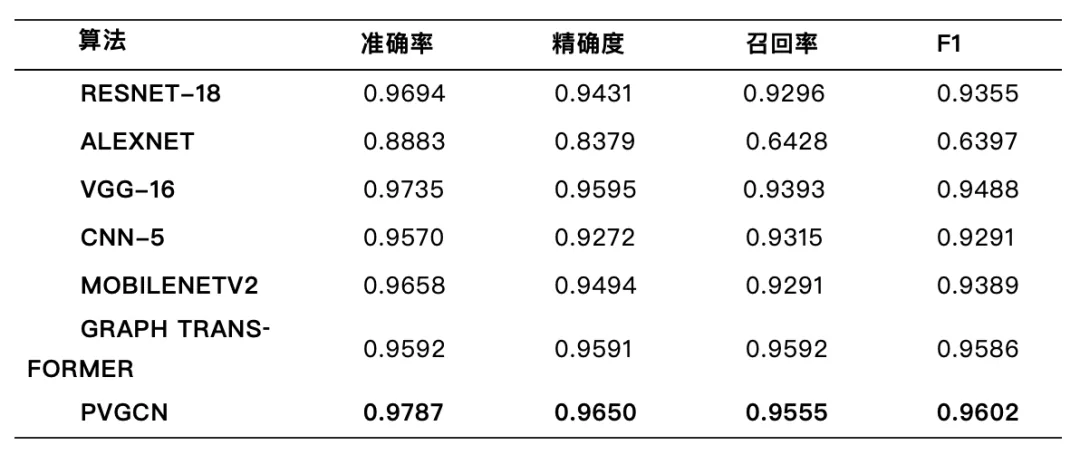
Table 3: Experimental results on CELL data sets with different ratios
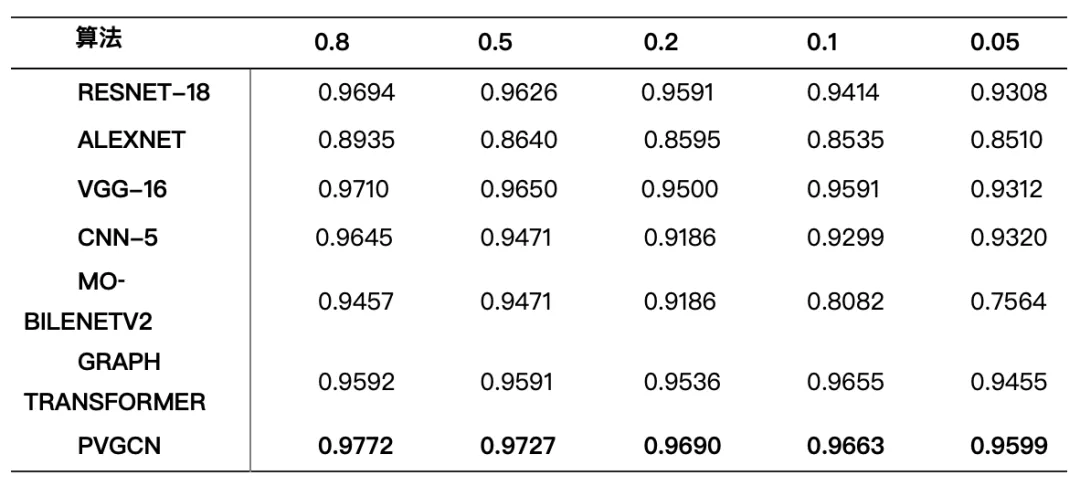
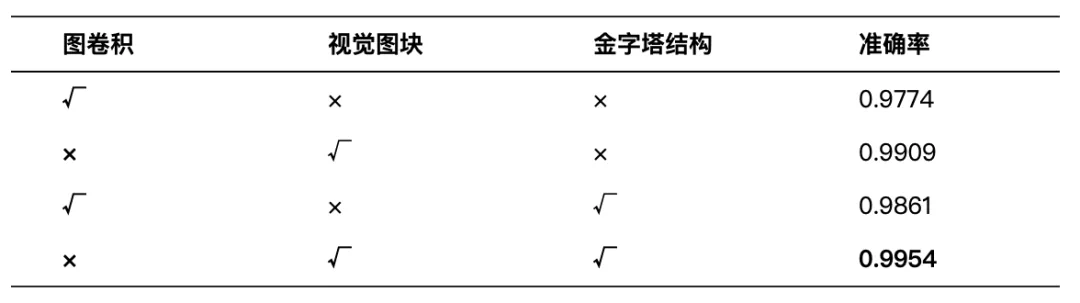
Table 4-5 shows the effect of the PVGCN components. It can be seen from the experimental results that canceling the fully connected layer (FC) and feedforward neural network (FFN) modules and directly using GCN for training will worsen. The lack of FC and FFN will lead to a decrease in feature expression ability. Next, after only introducing FC, the results show that the accuracy has been improved. On this basis, we continue to add the FFN module, and finally get good results. This indicates that these modules play an important role in PVGCN, adding more feature transformations. At the same time, we compared the impact of the improved Vision Graph and pyramid structure on the experimental accuracy. It can be seen from this that the accuracy of the improved vision module compared to the unimproved module increased from 0.9774 to 0.9909. We verified the performance advantage of the pyramid structure on the PVGCN model. PVGCN using the pyramid structure can achieve an accuracy of 0.9954, which is 0.9909 compared to the isotropic PVGCN, which improves the performance. The above experimental data shows that the Vision Graph block and pyramid structure play an important role in improving the accuracy of the model.
Table 4: Comparative effects of different components in graph convolution
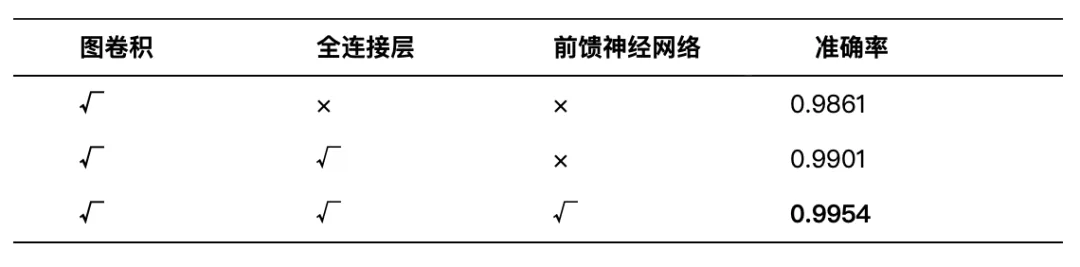
Table 5: Comparative effects of different components of PVGCN
In Table 6, we use only one level of scale, combine the first and second levels of scale, combine the previous three levels of scale, and combine the information of all four scales to conduct experimental verification. The experimental results show obvious performance differences: in terms of accuracy comparison, there is a significant improvement from 0.5638 at one scale to 0.9787 at four scales. Comparative reference indicators such as precision rate, recall rate and F1 score also reflect the trend of significant improvement in performance by combining information at different scales. Table 7 shows the optimized performance indicators on the CELL data set. Compared with the original results, the accuracy, precision and F1 indicators of the model after balanced training will increase slightly, while the recall rate will decrease slightly. The above experimental results show that the class balancing strategy can indeed effectively improve the model’s detection ability of minority class samples. The gap in specific experiments is not very large and does not affect the overall performance.
Table 6: Comparative effects at different scales
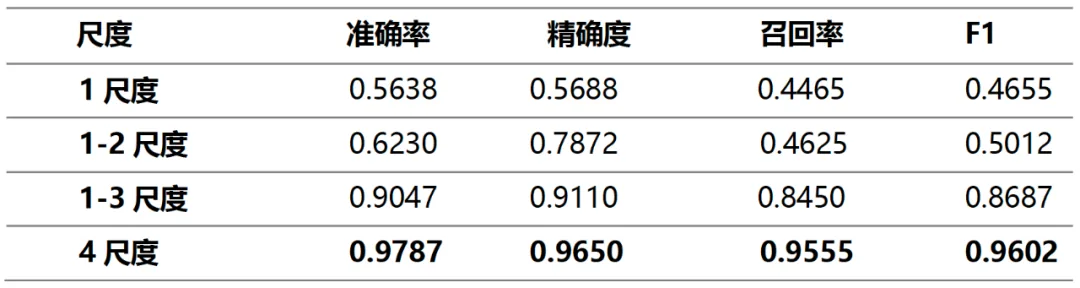
Table 7: Analysis of the impact of the class balancing strategy based on data augmentation on the performance of the PVGCN model on the CELL data set

When constructing the graph, the number of neighbors K is used as a hyperparameter to control the aggregation range. Its reasonable value represents the number of adjacent nodes. Different K values have a greater impact on the degree of information exchange. Analyze the impact of the same data on accuracy under different K values. In the specific experiment, K took values of 3, 6, 9 and 12 respectively, and the corresponding experimental results are shown in Table 8. The results show that when the number of neighbor nodes is between 9 and 12, the classification task performs well. In order to balance performance and quality, 9 was selected as the final experimental parameter in the model settings.
Table 8: Impact on accuracy under different k values

The confusion matrix of the method in this paper is shown in Figure 2. It is obvious that our method produces high classification accuracy for NORMAL and AMD classes. However, the identification accuracy of DME is slightly lower, which can be attributed to the scarcity of DME samples and the presence of samples with extremely small lesion areas. Nonetheless, the overall performance of our method is excellent.
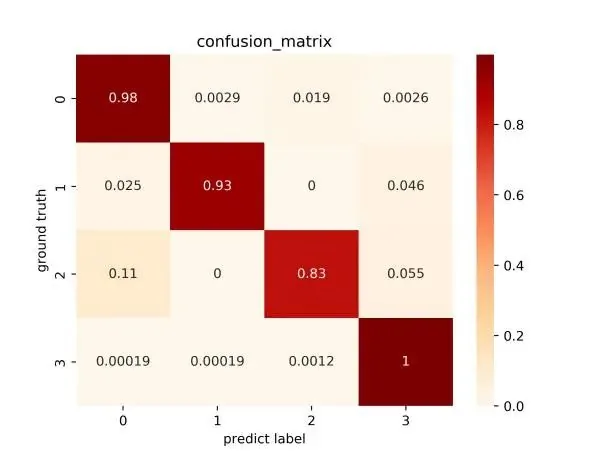
Figure 2: Confusion matrix of this paper’s algorithm on two data sets
In this paper, the CELL dataset contains 1000 OCT images annotated by 6 ophthalmologists organized by Kermany et al. The proposed PVGCN method performs well in tests on the CELL dataset. In Figure 3, the highest accuracy of ophthalmologists can reach 0.997, and the lowest accuracy is about 0.921. The accuracy of the PVGCN method ranks among the top three among ophthalmologists, which can prove that our proposed PVGCN method can reach the level of ophthalmologists.
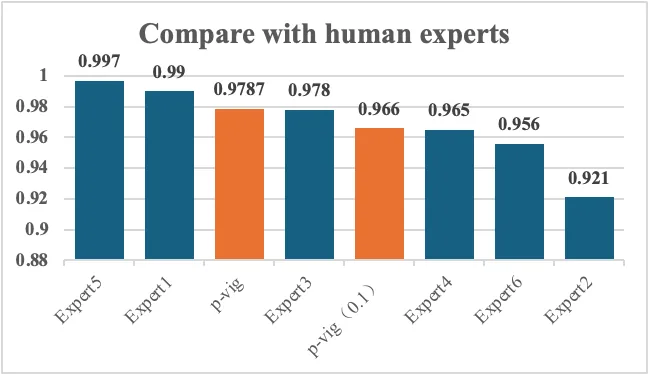
Figure 3: Comparison of accuracy between the method proposed in this paper and ophthalmologists
Summary
In this paper, we propose a novel pyramid-structured visual neural network model (PVGCN) for retinal disease recognition. This model uses the Vision Graph module, which combines the Grapher module and the FFN module as a basic unit, uses graph convolution technology to aggregate and update graph information, and combines nonlinear transformation to solve the over-smoothing problem in the image. The gradually shrinking pyramid structure of PVGCN better utilizes the characteristics of the graph structure and naturally captures the connections between various structures from multiple scales. In addition, by adopting space reduction, the consumption of computing resources is reduced, making PVGCN more lightweight. On two popular OCT datasets (BOE and CELL), PVGCN achieved the best results of 0.9954 and 0.9787 respectively, surpassing other compared deep learning methods. Furthermore, on the CELL dataset, the PVGCN network reached the level of top ophthalmologists.
Paper 2: “Cross-domain retinopathy classification based on OCT sensors (via domain adversarial graph convolutional network)”
- Introduction
Existing domain adaptation methods have limitations: first, the neglect of data structure. Traditional domain adaptation methods rely on global statistical alignment, thereby ignoring the local structural relationship of the image; second, the deviation of category semantics. Methods that rely only on label information are usually susceptible to noise interference, leading to confusion of category features; and there is a lack of computational efficiency. Complex alignment strategies will increase model complexity, making it difficult to meet clinical real-time needs.
In order to solve the above problems, this study innovatively proposes the DAGCN framework. The core contributions are as follows: The first point is to use the data structure-aware alignment module to capture the local structural information of the OCT image and reduce the inter-domain geometric offset by using the graph convolution network (GCN) to build the instance map; the second point is to use the class center alignment module to enhance the cross-domain semantic consistency by reducing the distance between the same category feature centers in the source domain and the target domain. In addition, this study achieves efficient domain-invariant feature learning through multi-loss joint optimization, combining adversarial loss, entropy minimization loss and domain similarity loss.
- Method
The DAGCN method flow is shown in Figure 4, which is divided into three steps:
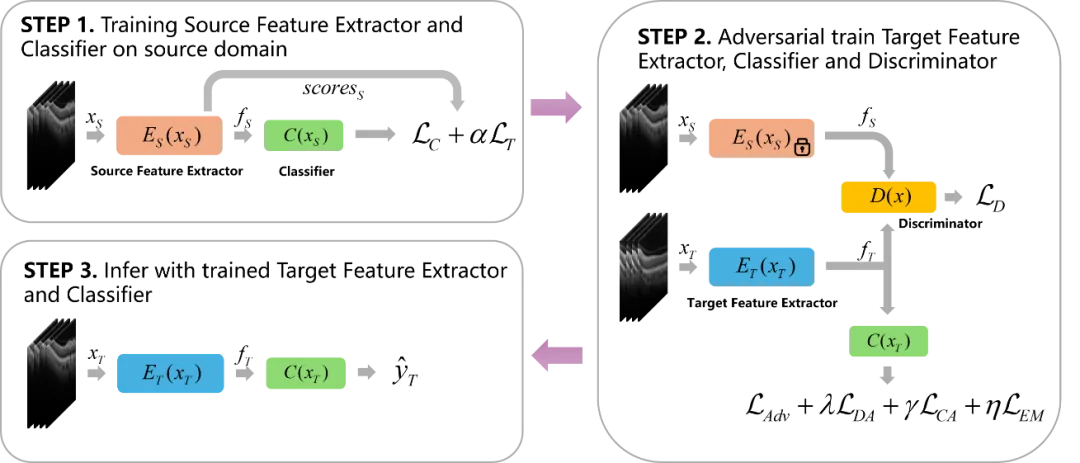
Figure 4: Overview of cross-domain retinopathy classification method based on DAGCN optical coherence tomography
DAGCN consists of three steps. In step one, we first use source domain data to train the source domain feature extractor and classifier, and guide the training of the source domain feature extractor and classifier through cross-entropy loss and data structure-aware alignment loss, where the data structure-aware alignment loss is calculated by the structure score generated in the source domain data training source domain feature extractor;
In step two, we initialize the target feature extractor using the weights of the source domain feature extractor. It is worth noting that at this time is fixed and does not need to be updated during this step. Then, we use adversarial loss , entropy minimization loss, domain adversarial similarity loss and class centroid alignment loss to train the sum, and for the discriminator, we also use a cross-entropy loss to guide its training;
In the final step three, we use the target feature extractor and classifier to make inference predictions on the target domain data.
- Experimental results
This study verified the performance of DAGCN on three public OCT data sets (BOE marked as A, TMI marked as B, and CELL marked as C), covering three cross-domain scenarios (A→B, A→C, B→C). The experimental results are as follows:
Table 9: Classification experiment results of each method in different cross-domain scenarios
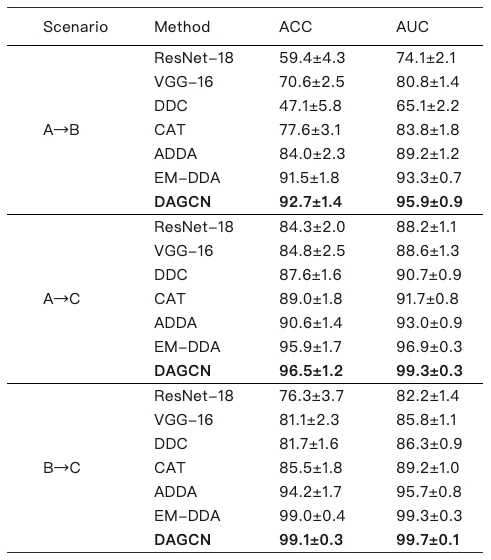
Experiments show that the classification accuracy of DAGCN in three scenarios reaches 92.7%, 96.5% and 99.1% respectively, which is significantly better than benchmark methods such as ResNet-18 and ADDA (as shown in Table 9). In addition, the inference speed of DAGCN is 22%-25% higher than that of the suboptimal method (EM-DDA), and single image processing only takes 4ms, meeting the real-time clinical needs (results are shown in Table 10).
Table 10: Inference time of each method in different cross-domain scenarios
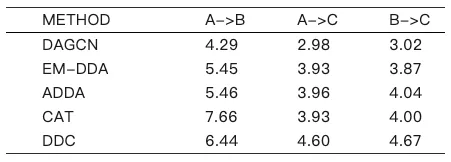
Table 11: Ablation experiment results
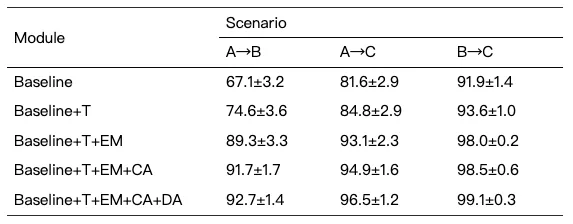
Through ablation experiments (shown in Table 11), this study proved that all the designed modules play a significant role in the cross-domain classification of OCT images.
This study also conducted sensitivity analysis on several important parameters used in the method, and the results are shown in Figure 5. There are 5 important hyperparameters in our method, also called weight balance parameters. Sensitivity analysis shows that the model is insensitive to changes in λ, but it can still slightly improve the performance of the model, while a moderate increase in γ can improve performance, while an excessive increase in γ can lead to performance degradation due to excessive category compression.
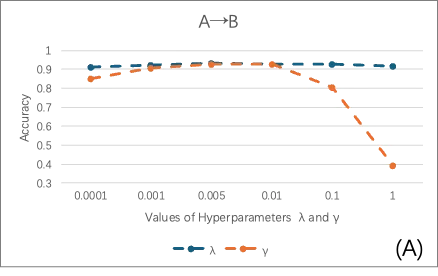
a, A→B scenario
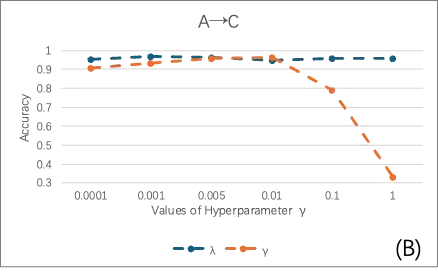
b. In the scenario A→C
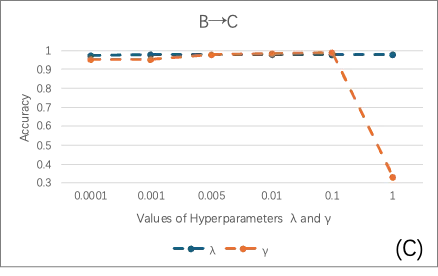
c, B→C scenario
Figure 5: The impact of hyperparameters and on model performance under different values in three scenarios
In addition, through t-SNE feature visualization (shown in Figure 6), it can be seen that DAGCN effectively aligns the data distribution of the source domain and the target domain, and enhances the separability between categories, while the baseline method (without domain adaptation) has obvious inter-domain differences.
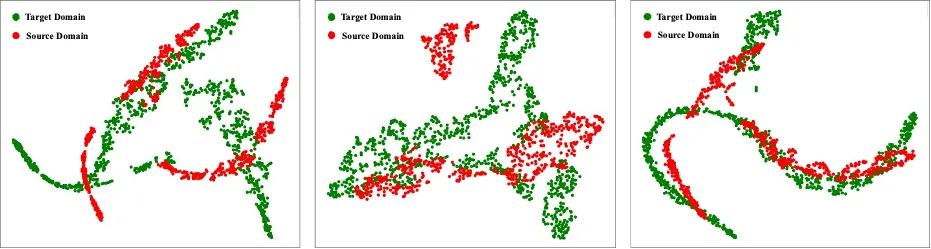
(a) Baseline: A→B; (b) EM-DDA: A→B; (c) DAGCN: A→B
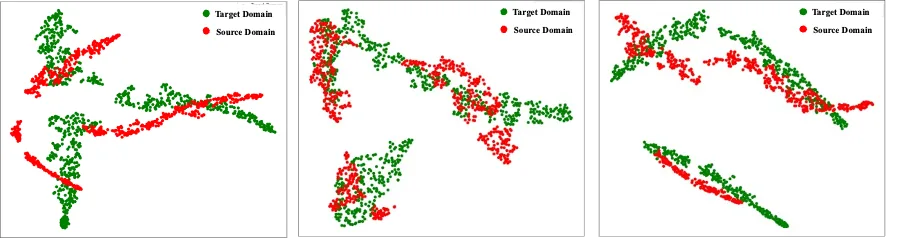
(b) Baseline: A→C; (b) EM-DDA: A→C; (c) DAGCN: A→C
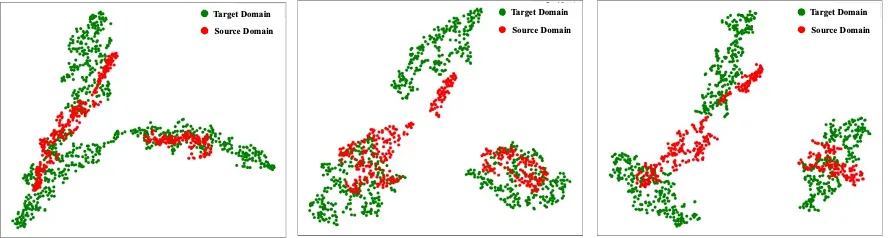
( c) Baseline: B→C; (b) EM-DDA: B→C; (c) DAGCN: B→C
Figure 6: Stochastic Neighbor Embedding (t-SNE) visualization of T distribution in cross-domain tasks A→B, A→C, B→C
Compared with ophthalmologists, on data set C, DAGCN’s accuracy in the B→C scenario (99.1%) surpassed four ophthalmologists and was the same as the best experts; its accuracy in the A→C scenario (96.5%) was also better than three experts. This result highlights its potential for auxiliary diagnosis.
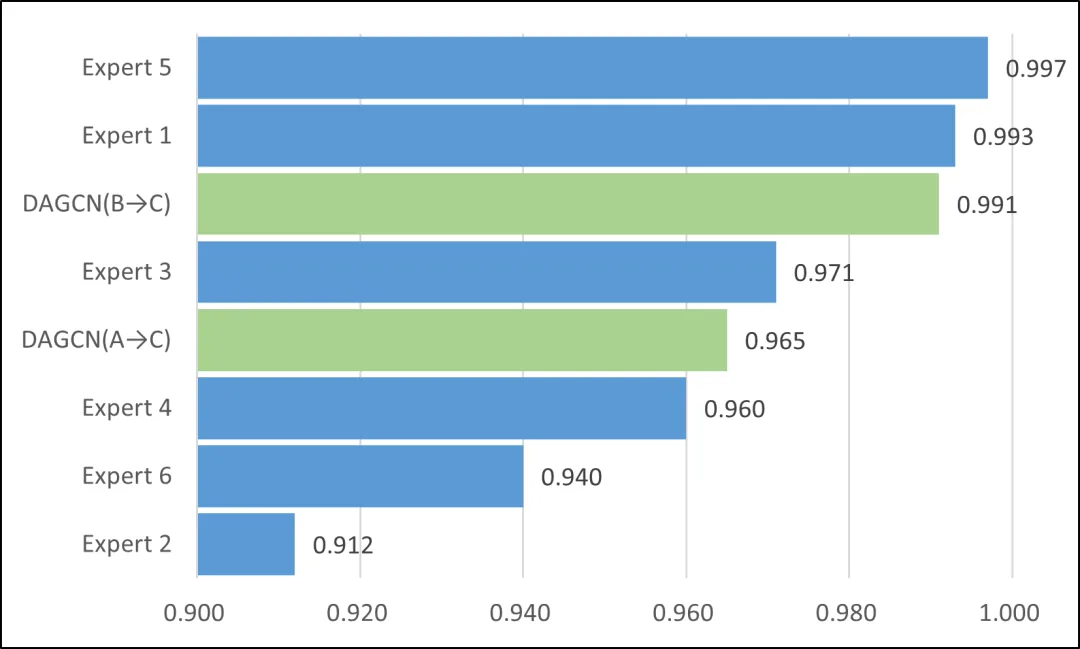
Figure 7: Classification accuracy comparison with ophthalmologists
Summary
This paper proposes a Domain Adversarial Graph Convolution Network (DAGCN) for retinopathy classification in optical coherence tomography (OCT) images, which significantly improves cross-domain classification performance through two innovative modules: the first is a structure-aware alignment module, which constructs a densely connected instance graph through the multi-level fusion of data structure analyzers and feature extractors as input to the graph convolution network; the second is a class centroid alignment module, which uses category labels to progressively optimize the category centroid distance between the target domain and the source domain to enhance unsupervised domain adaptation capabilities.
Experiments show that the classification accuracy of DAGCN in three groups of cross-domain scenarios reaches 92.7%, 96.5% and 99.1% respectively, which is better than the comparative method, and the visualization results verify the advantages of intra-class aggregation and inter-class separation of its features. This shows that DAGCN has overcome the domain shift problem in cross-domain classification of OCT images and can achieve high-precision and efficient diagnosis of retinopathy with only a small amount of annotated data. Moreover, this method reaches or exceeds the level of ophthalmologists in many indicators, providing a reliable solution for intelligent diagnosis between clinical heterogeneous devices. Of course, there are still some areas for improvement in this study, such as improving the robustness of the model under extreme imaging conditions (such as different devices/protocols) and class imbalance (such as rare lesions). In the future, the research team will further explore its application in multi-modal medical image analysis and continuously improve it to promote artificial intelligence to empower precision medicine.
The following is information from the two papers:
[1] Jin Qian, Lei Tao, Changhao Gong, Jun Xu, and Yuemei Luo*, “Classifying Retinal Diseases via a Novel Pyramid Vision Graph Convolutional Network for Optical Coherence Tomography Images,” Biomedical Optics Express , Accepted, (2025).
[2] Lei Tao, Jin Qian, Changhao Gong, Dingfa Zhang, and Yuemei Luo*, “Cross-Domain Retinopathy Classification in Optical Coherence Tomography Images Based on Domain Adversarial Graph Convolutional Network,” IEEE Sensors Journal , 2(15), 3473-3483 (2025).
Translated from the original Chinese source.